What’s the right rent? Find out the average rental prices for UK & London 2022


The price of rent is going up! But by how much and what is the difference in rents across the country?
There are tons of differing studies out there on average rental prices, and it’s easy to get lost in the data. If you’re struggling to crunch the numbers, you’re not the only one. In this guide, we’ve tried to simplify it for you.
As a leading UK lettings and rental platform, Mashroom’s mission is to improve rental relationships for thousands of tenants and landlords. And the cornerstone of that is… getting the rent right. Whether you’re a tenant or a landlord, the better informed you are about the current rental prices, the happier you’re likely to be.
If the rent’s set too high, tenants will move on, looking for a better deal, or may fall behind in rental payments (check out landlord insurance, particularly Rent Guarantee Insurance, to protect against this). If the rent is too low, landlords could find themselves struggling to meet their mortgage repayments each month – putting both the landlord and the tenant in jeopardy.
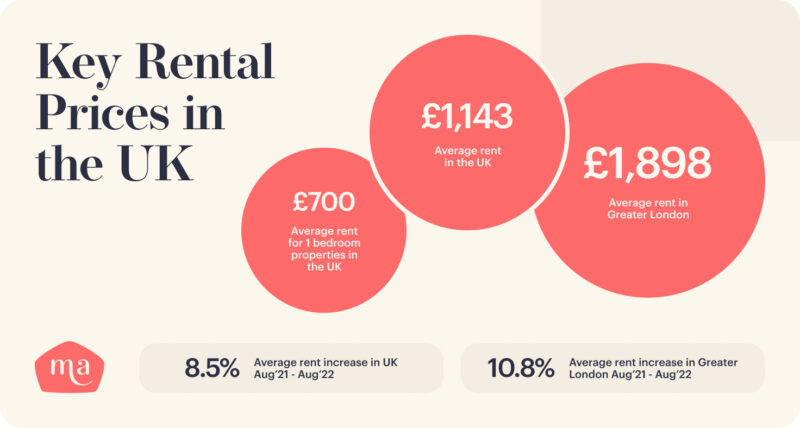
Key Rental Prices in the UK
- UK average rent: £1,143 [1]
- Greater London average rent: £1,898 [2]
- Average rent in the UK has increased 8.5% from Aug 2021 to Aug 2022 [2]
- Average rent in Greater London has increased 10.8% from Aug 2021 to Aug 2022 [2]
- One bedroom properties average £700 pcm in the UK [3]
What caused the rental price increase?
Rent across the country is on the up and up, and it won’t come as any surprise to see that rent in and around London is amongst the highest in the country, due to the abundance of jobs and leisure activities that make it one of the most expensive places to work (and play!).
However, rents across the rest of the country are much lower than in the capital, bringing the overall UK average rent price down.
The general average rent prices for 2022 in the UK
Overall, rental prices across the UK are continuing to grow steadily with an overall increase of 14.7% [4] since 2015. The highest average rent is to be found in London at £1,898, and the lowest rents, less than half the cost, are to be found in Wales, Yorkshire & the Humber at £778. [2]
Overall, the average UK rent sits at £1,143. However, if you remove London rents, the average UK rent is £961, so you can see the impact that rents in the capital have! [1]
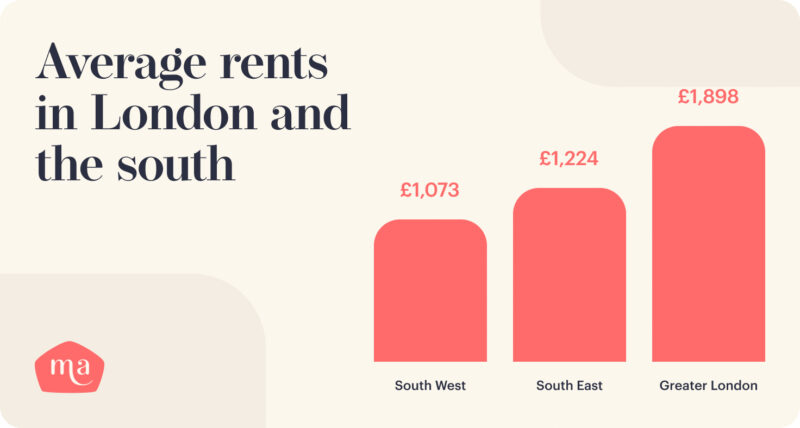
Average rents in London and the south
- Greater London average rent: £1,898 [1]
- South East average rent: £1,224 [1]
- South West average rent: £1,073 [1]
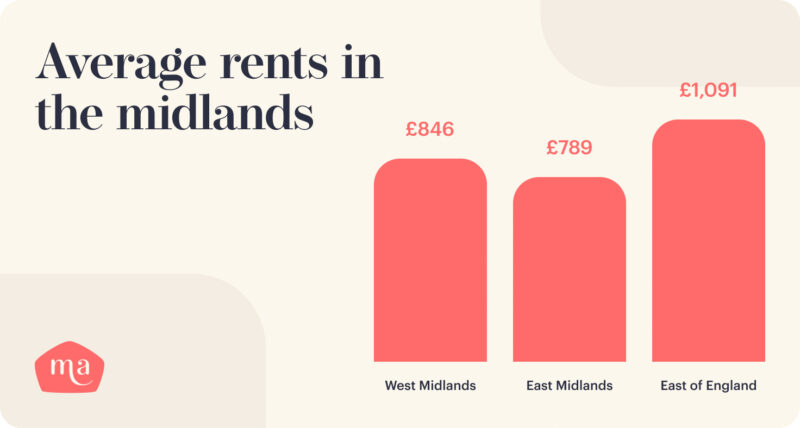
Average rents in the midlands
- East of England average rent: £1,091 [1]
- East Midlands average rent: £789 [1]
- West Midlands average rent: £846 [1]
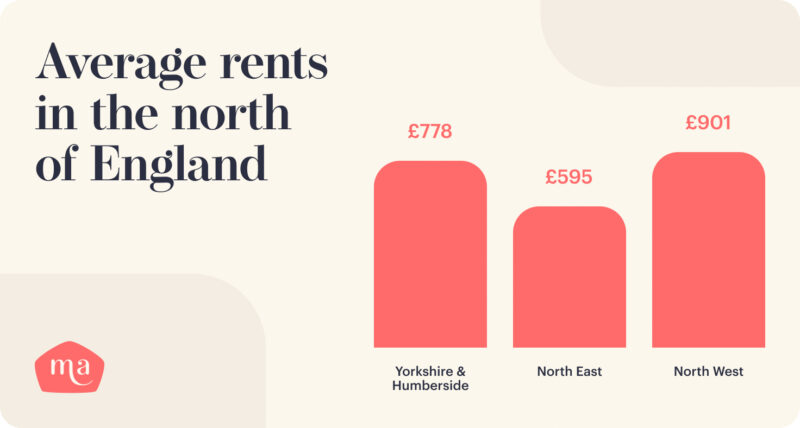
Average rents in the north of England
- North West average rent: £901 [1]
- North East average rent: £595 [1]
- Yorkshire & Humberside average rent: £778 [1]
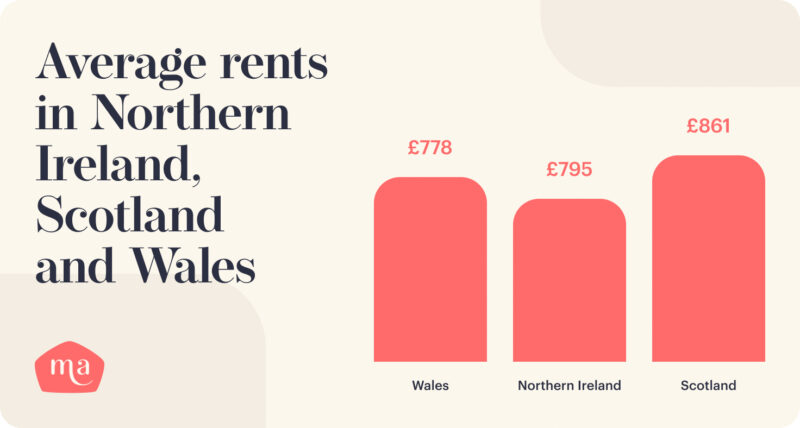
Average rents in Northern Ireland, Scotland and Wales
- Scotland average rent: £861 [1]
- Northern Ireland average rent: £795 [1]
- Wales average rent: £778 [1]
The UK rental average changes from August 2021 to August 2022
Rents are changing at a rapid pace since the easing of all pandemic restrictions. Not even the cost-of-living crisis seems to be bringing them down.
- Outside London, average rents have increased by 7.7% on last year, reaching a new high of £961 a month [1]
- Since the pandemic started two years ago, rents around the country have rocketed up by 19%, that’s an extra £177 a month for tenants to find [5]
- London rents are also growing, with a record £2,257 recently reached [5]
- Annual growth for rent in London is at 10.8%, the fastest ever rate of any region [2]
- Since January 2022, there has been an 8% increase in the number of rental listings coming onto the market [5]
- June 2022 had the highest number of new rental listings of any month this year so far [5]
- Rental stock is still down 26% on last year’s levels [5]
- Demand is up 6%, meaning we can expect to see plenty more competition between tenants for rental properties [5]
These rental increases are being caused by a shortage of available rental properties. Over the past two years there has been a large surge in demand, with lots of people on the move, but not enough rental property becoming available.
- UK average rent: 8.5% [2]
- UK (excluding Greater London) average rent: 7.7% [2]
Scotland, Wales and Northern Ireland
Scotland’s and Northern Ireland’s increase surprisingly beats London’s increase!
- Scotland average rent: 13.6% [2]
- Northern Ireland average rent: 12.9% [2]
- Wales average average rent: 7.6% [2]
London and the South
London leads the increase in the south of England, with the South West in particular lagging behind.
- Greater London average rent: 10.8% [2]
- South East average rent: 8.1% [2]
- South West average rent: 6.7% [2]
The Midlands
The Midlands is consistently the lowest across the board, so the best bet for tenants who are able to work remotely and looking to save on rent!
- East of England average rent: 6.9% [2]
- East Midlands average rent: 6.3% [2]
- West Midlands average rent: 7.1% [2]
The North
Usually one of the cheaper places to rent, the North is outpacing the Midlands when it comes to rent increases.
- North West average rent: 9.9% [2]
- North East average rent: 4.0% [2]
- Yorkshire & the Humber average rent: 7.5% [2]
Average rental prices in London, including the City of London
In the 12 months up to June 2022, rental prices for the UK, not including London, saw a lot of change:
- Average rental prices in the UK (excluding London) increased by 3.6%, up from an increase of 3.4% in May 2022 [6]
- London private rental prices increased by 1.7% in the 12 months to June 2022, up from an increase of 1.5% in May 2022 [6]
- This was the highest annual rate since February 2017 [6]
- London’s rental price growth in June 2022 remains the lowest of any of the English regions [6]
The increase in London rental prices from August 2021 to August 2022 is reflective of the aftermath of the pandemic. People left London in their thousands during the various lockdowns to move to cheaper areas or back with family, to save on those high rents. However, as we returned to normal in mid-late 2021, there was a surge back into the cities (and not just to London!) which saw huge competition among tenants, which drove rental prices sky high.
Rents are highly dependent on location and the number of bedrooms, with Hillingdon, Havering and Sutton boasting some of the lowest London rents available.
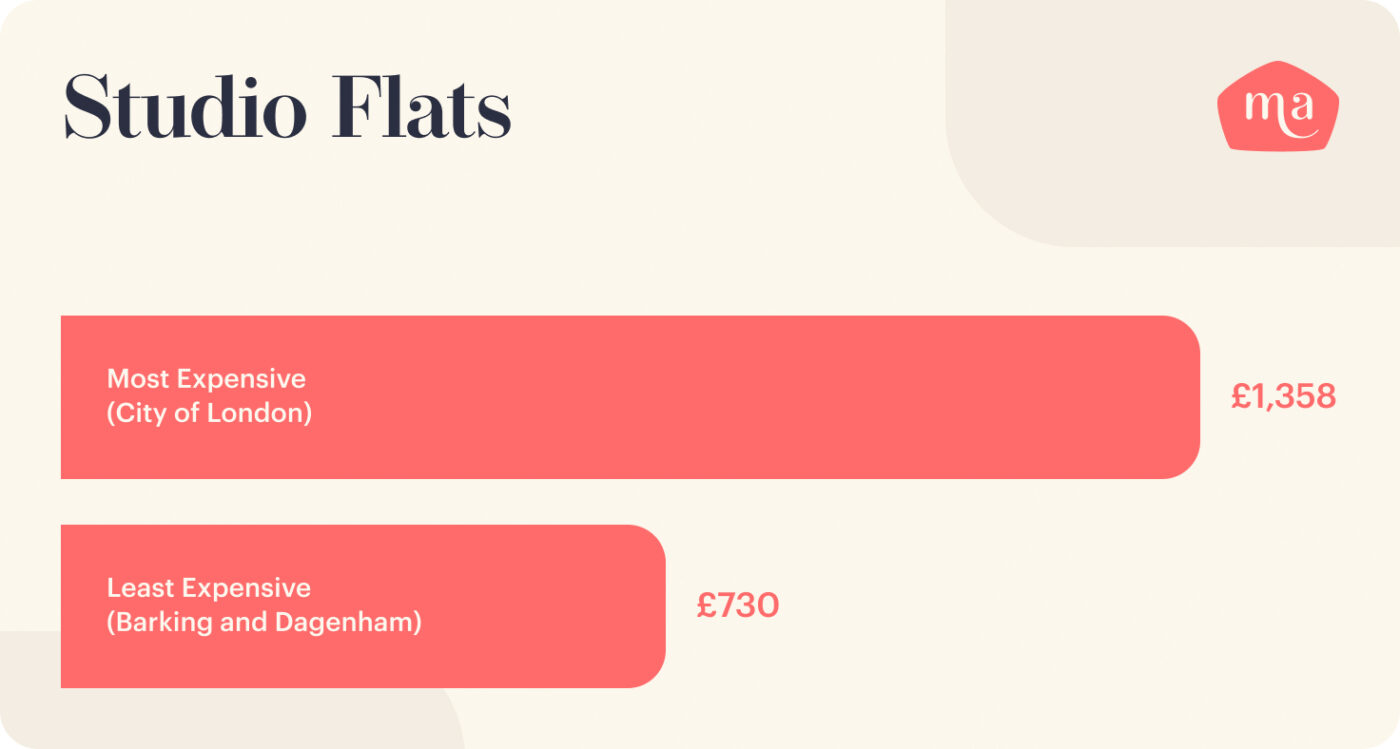
Highest average monthly rental cost of studio properties in London
Many people moving to London are looking for studios because they are amongst the cheapest places to rent because of their small size. Despite that, the prices are still eye-watering:
- City of London average rent: £1,358 [7]
- Kensington and Chelsea average rent: £1,300 [7]
- City of Westminster average rent: £1,213 [7]
- Tower Hamlets average rent: £1,200 [7]
- Newham average rent: £1,198 [7]
Lowest average monthly rental cost of studio properties in London
However, if you choose to live a little further out of from the centre of town, you can find something that’s far more in your budget:
- Barking and Dagenham average rent: £730 [7]
- Hillingdon average rent: £750 [7]
- Havering average rent: £760 [7]
- Redbridge average rent: £780 [7]
- Sutton average rent: £795 [7]
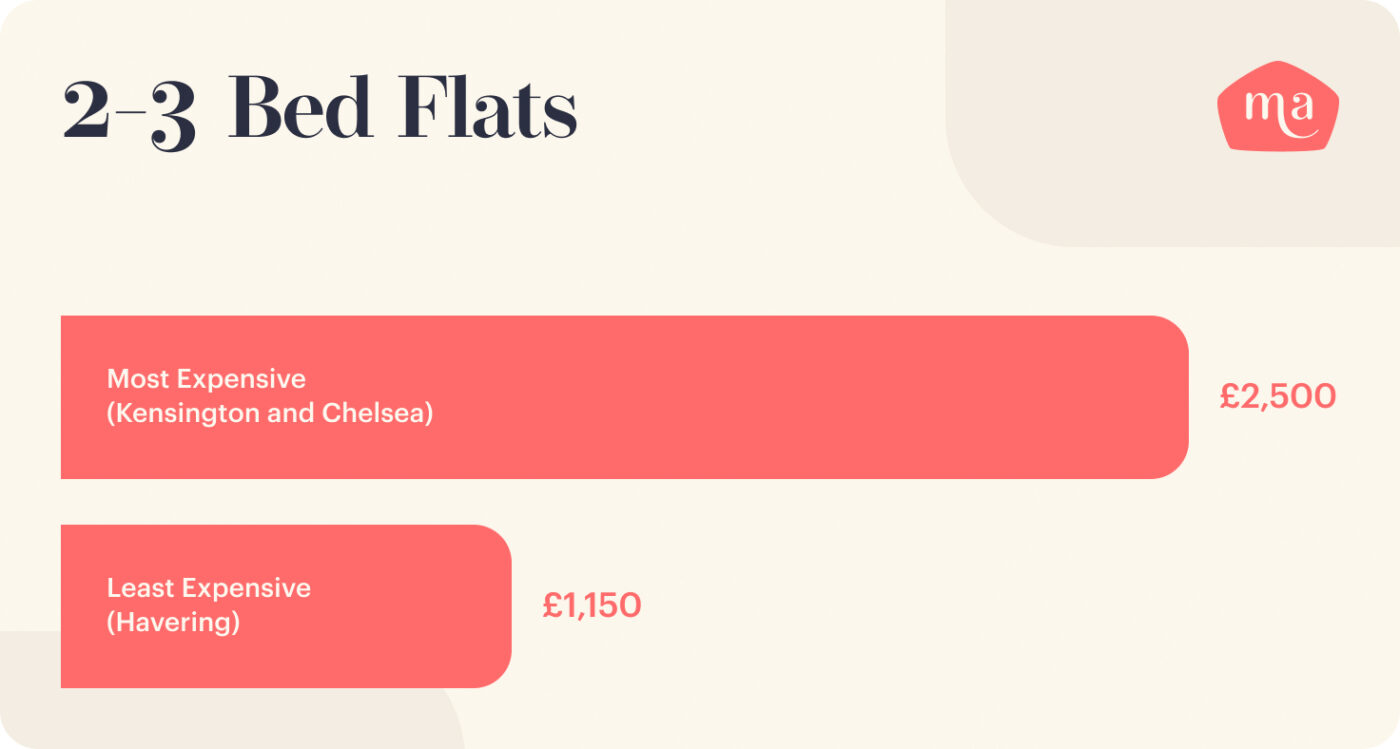
Highest average monthly rental cost of 2-bedroom properties in London
Post-pandemic, renters are looking for more than just 1-bedroom properties, so they have space to work from home. However, those who do want more space to work and those who have families, will find themselves having to dig deep to pay for the space in the more popular areas of the capital:
- Kensington and Chelsea average rent: £2,500 [7]
- City of London average rent: £2,297 [7]
- City of Westminster average rent: £2,275 [7]
- Camden average rent: £2,050 [7]
- Islington average rent: £1,844 [7]
Lowest average monthly rental cost of 2-bedroom properties in London
There are cheaper areas in London, slightly further out from the centre of town, but with the introduction of the new Elizabeth line, commuting has never been easier and could save you thousands!
- Havering average rent: £1,150 [7]
- Sutton average rent: £1,195 [7]
- Bexley average rent: £1,200 [7]
- Croydon average rent: £1,250 [7]
- Hillingdon average rent: £1,250 [7]
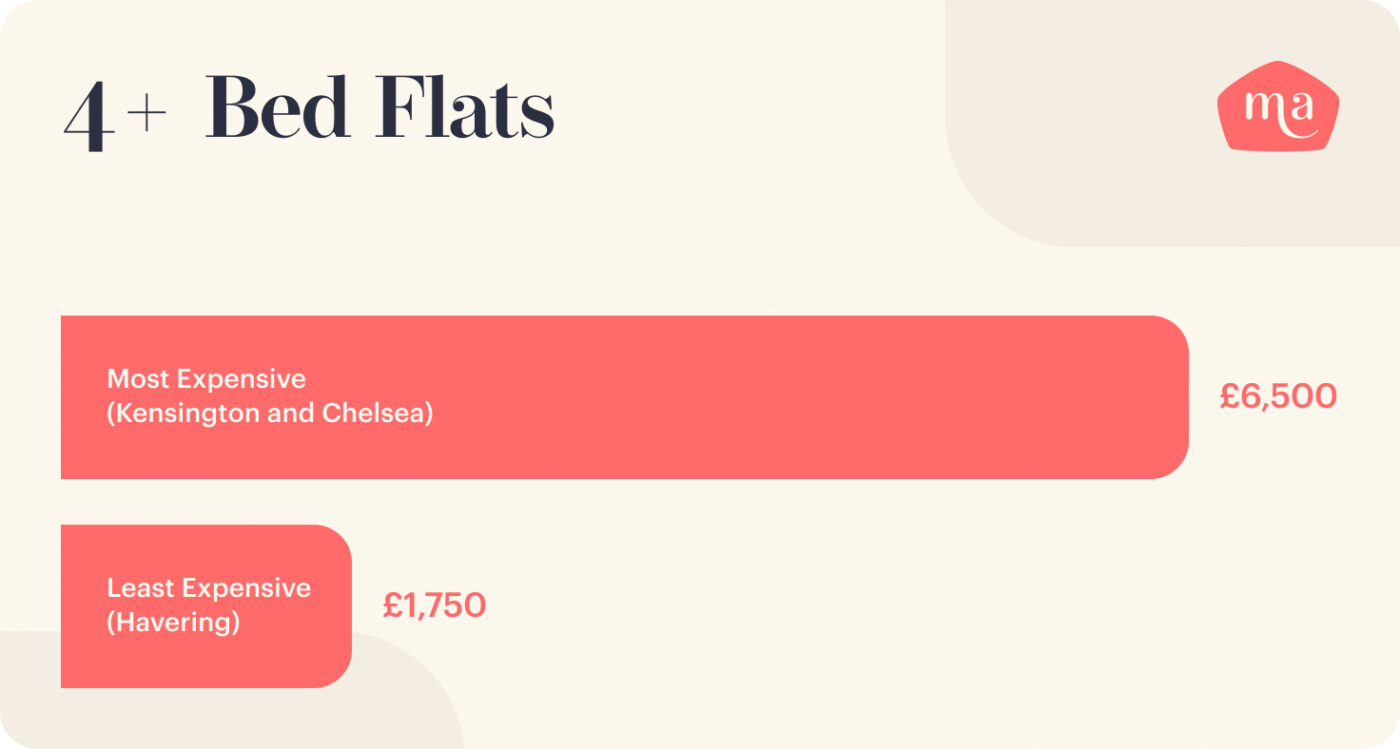
Highest average monthly rental cost of 4 or more-bedroom properties in London
If you’re looking for space for all your family and maybe even a guest room, you’re looking at very high prices. These rents price out the average renter, who would be entirely unable to afford these areas on an average UK wage:
- Kensington and Chelsea average rent: £6,500 [7]
- City of Westminster average rent: £4,937 [7]
- Hammersmith and Fulham average rent: £4,008 [7]
- Richmond upon Thames average rent: £3,675 [7]
- Wandsworth average rent: £3,300 [7]
Lowest average monthly rental cost of 4 or more-bedroom properties in London
However, if you do want a larger home and need to be in the capital, there are cheaper options. It’s just a case of giving up the higher end areas of London for somewhere further out and more up-and-coming than established:
- Havering average rent: £1,750 [7]
- Hillingdon average rent: £1,950 [7]
- Croydon average rent: £1,975 [7]
- Sutton average rent: £1,995 [7]
- Redbridge average rent: £2,000 [7]
The average rent in Scotland
The annual rental growth for Scotland continues to surpass England and Wales, and the country has seen faster growth than in the previous year, with a 14.2% increase in average rental values, to £862 per month from September 2021 to September 2022 [8].
The market’s low supply and high demand saw the highest increase – 15.3% – belonging to Dundee. Edinburgh was hot on Dundee’s heels though at 15.1%, Glasgow wasn’t far behind, at a 13% increase. And while Aberdeen’s increase of 4.4% may seem modest, it appears to herald a turnaround after a period of rent falls and stagnation. [9]
Scotland was once a land of oversupply, but now demand is far outweighing supply. While this is good news for landlords, it means tenants will be under pressure to pay more and commit quickly in order to secure a home.
- Edinburgh average rent: £1,283 [9]
- Glasgow average rent: £997 [9]
- Aberdeen average rent: £738 [9]
- Dundee average rent: £767 [9]
- West Lothian average rent: £757 [9]
- South Lanarkshire average rent: £715 [9]
- Renfrewshire average rent: £633 [9]
The average rent in Northern Ireland
“The annual growth rate for Northern Ireland in August 2022 (8.4%) was higher than the other countries of the UK. Northern Ireland data have been copied forward since June 2022; the next update to Northern Ireland data will be in our Index of Private Housing Rental Prices, UK bulletin published on 14 December 2022.” [4]
Northern Ireland average rent is: £795 (as of August 2022) [2]
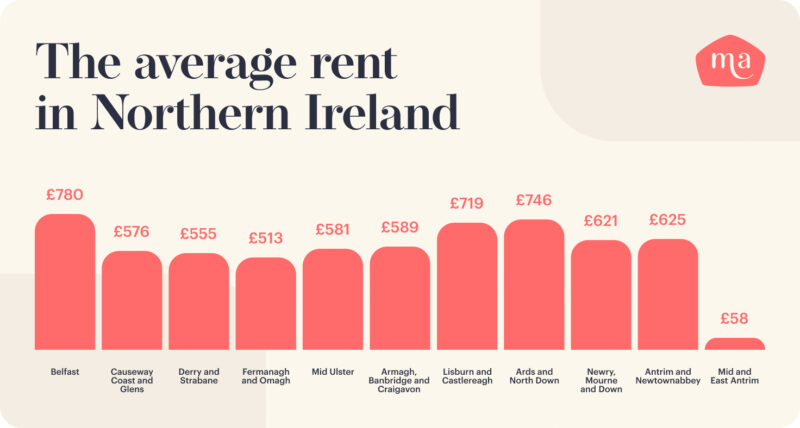
While the 2022 data for specific areas of Northern Ireland isn’t available yet, the 2021 data breaks down like this:
- Belfast average rent: £780 [10]
- Causeway Coast and Glens average rent: £576 [10]
- Derry and Strabane average rent: £555 [10]
- Fermanagh and Omagh average rent: £513 [10]
- Mid Ulster average rent: £581 [10]
- Armagh, Banbridge and Craigavon average rent: £589 [10]
- Lisburn and Castlereagh average rent: £719 [10]
- Ards and North Down average rent: £746 [10]
- Newry, Mourne and Down average rent: £621 [10]
- Antrim and Newtownabbey average rent: £625 [10]
- Mid and East Antrim average rent: £565 [10]
The average rent in Wales
Private rental prices grew by 2.5% in Wales in the 12 months to August 2022. This is up from an increase of 2.1% in July 2022 and is the highest annual growth rate in at least a decade. [4]
- Wales average rent: £794 (September 2022) [1]
- The following figures are from the second half of September 2022
- Cardiff average rent: £1,150 [11]*
- Barry average rent: £900 [11]*
- Newport average rent: £900 [11]*
- Swansea average rent: £806 [11]*
- Wrexham average rent: £575 [11]*
- Neath average rent: £758 [11]*
- Cwmbran average rent: £838 [11]*
- Bridgend average rent: £925 [11]*
* Please note, this is taken from live vary so please click through for the current average
The average rent in England
“In England, private rental prices grew by 3.2% in the 12 months to July 2022, representing the highest 12-month growth rate since December 2008. When London is excluded from England, private rental prices increased by 3.7% in the 12 months to July 2022. This is up from an increase of 3.6% in June 2022 and the highest 12-month growth rate since this series began in 2006.” [12]
- England average rent: £795 [13]
- Bristol average rent: £1,500 [11]*
- Nottingham average rent: £995 [11]*
- Sheffield average rent: £850 [11]*
- Liverpool average rent: £758 [11]*
- Newcastle average rent: £850 [11]*
- Birmingham average rent: £1,150 [11]*
- Cambridge average rent: £2,000 [11]*
- Southampton average rent: £1,100 [11]*
- Leeds average rent: £925 [11]*
- Manchester average rent: £1,200 [11]*
* Please note, this is taken from live vary so please click through for the current average
Are UK rental prices affordable?
There continues to be high tenant demand across the UK, but a lack of homes to meet that demand. While more rental properties are finally coming onto the market, with June having the highest number of new listings so far this year, the post-pandemic squeeze on supply is continuing to drive up rental prices. The average property in London now rents for £1898. An ever-increasing number of tenants are looking to move, and rental prices will keep increasing until supply catches up with demand.
There is some help at hand. Initiatives like Deposit Replacement Schemes can help make life easier for new tenants, by eliminating the need to find a whole extra month’s rent upfront to pay a deposit. And Landlords can avail themselves of Rent Guarantee Insurance to help protect themselves in these uncertain economic times.
Reference Sources
[1]: Homelet Rental Index (September 2022)
[2]: Let Alliance rental index report (August 2022)
[3]: Private rental market summary statistics in England: April 2021 to March 2022 (see fig 1)
[4]: Index of Private Housing Rental Prices, UK (August 2022)
[5]: Rightmove Rental Price Tracker
[6]: Index of Private Housing Rental Prices, UK: June 2022
[7]: London rent prices: which areas have the highest and lowest average prices?
[8]: HomeLet Average Rents in Scotland
[9]: Private Rented Accommodation Report Q2 2022 – Citylets
[10]: Ulster University – At a Glance Private Rental Market Performance 2021
[11]: Home.co.uk
[12]: Index of Private Housing Rental Prices, UK: July 2022
[13]: Private rental market summary statistics in England: April 2021 to March 2022


